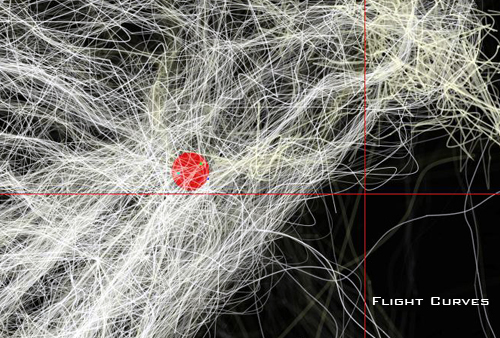
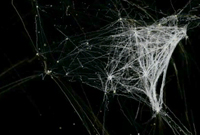
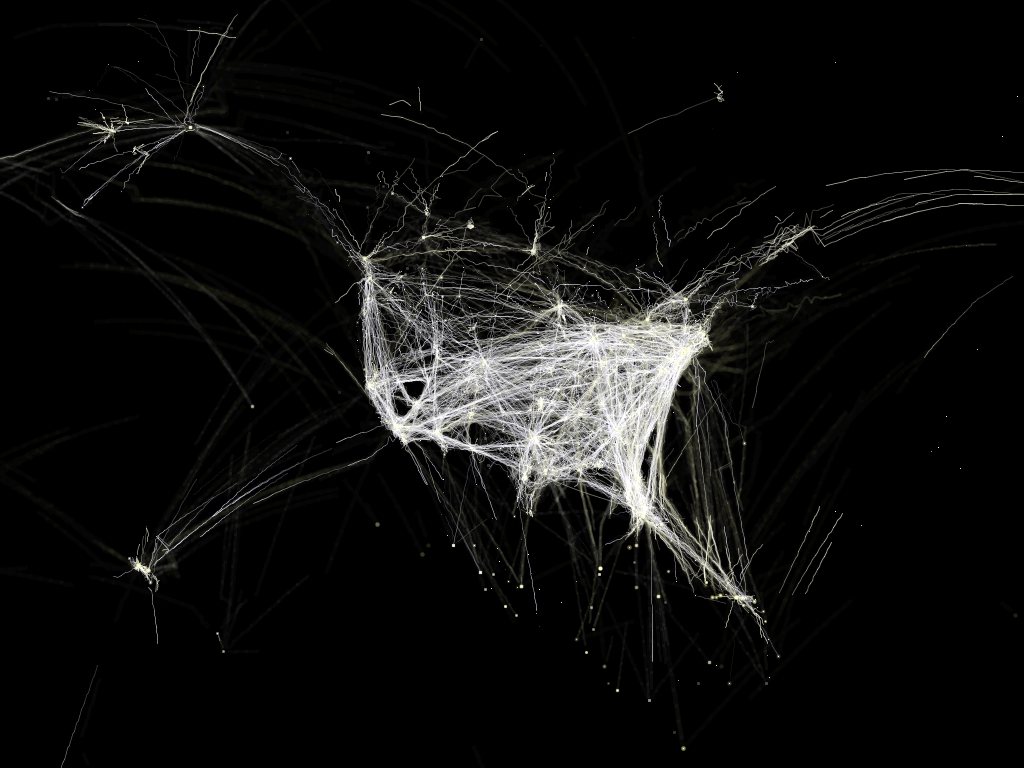
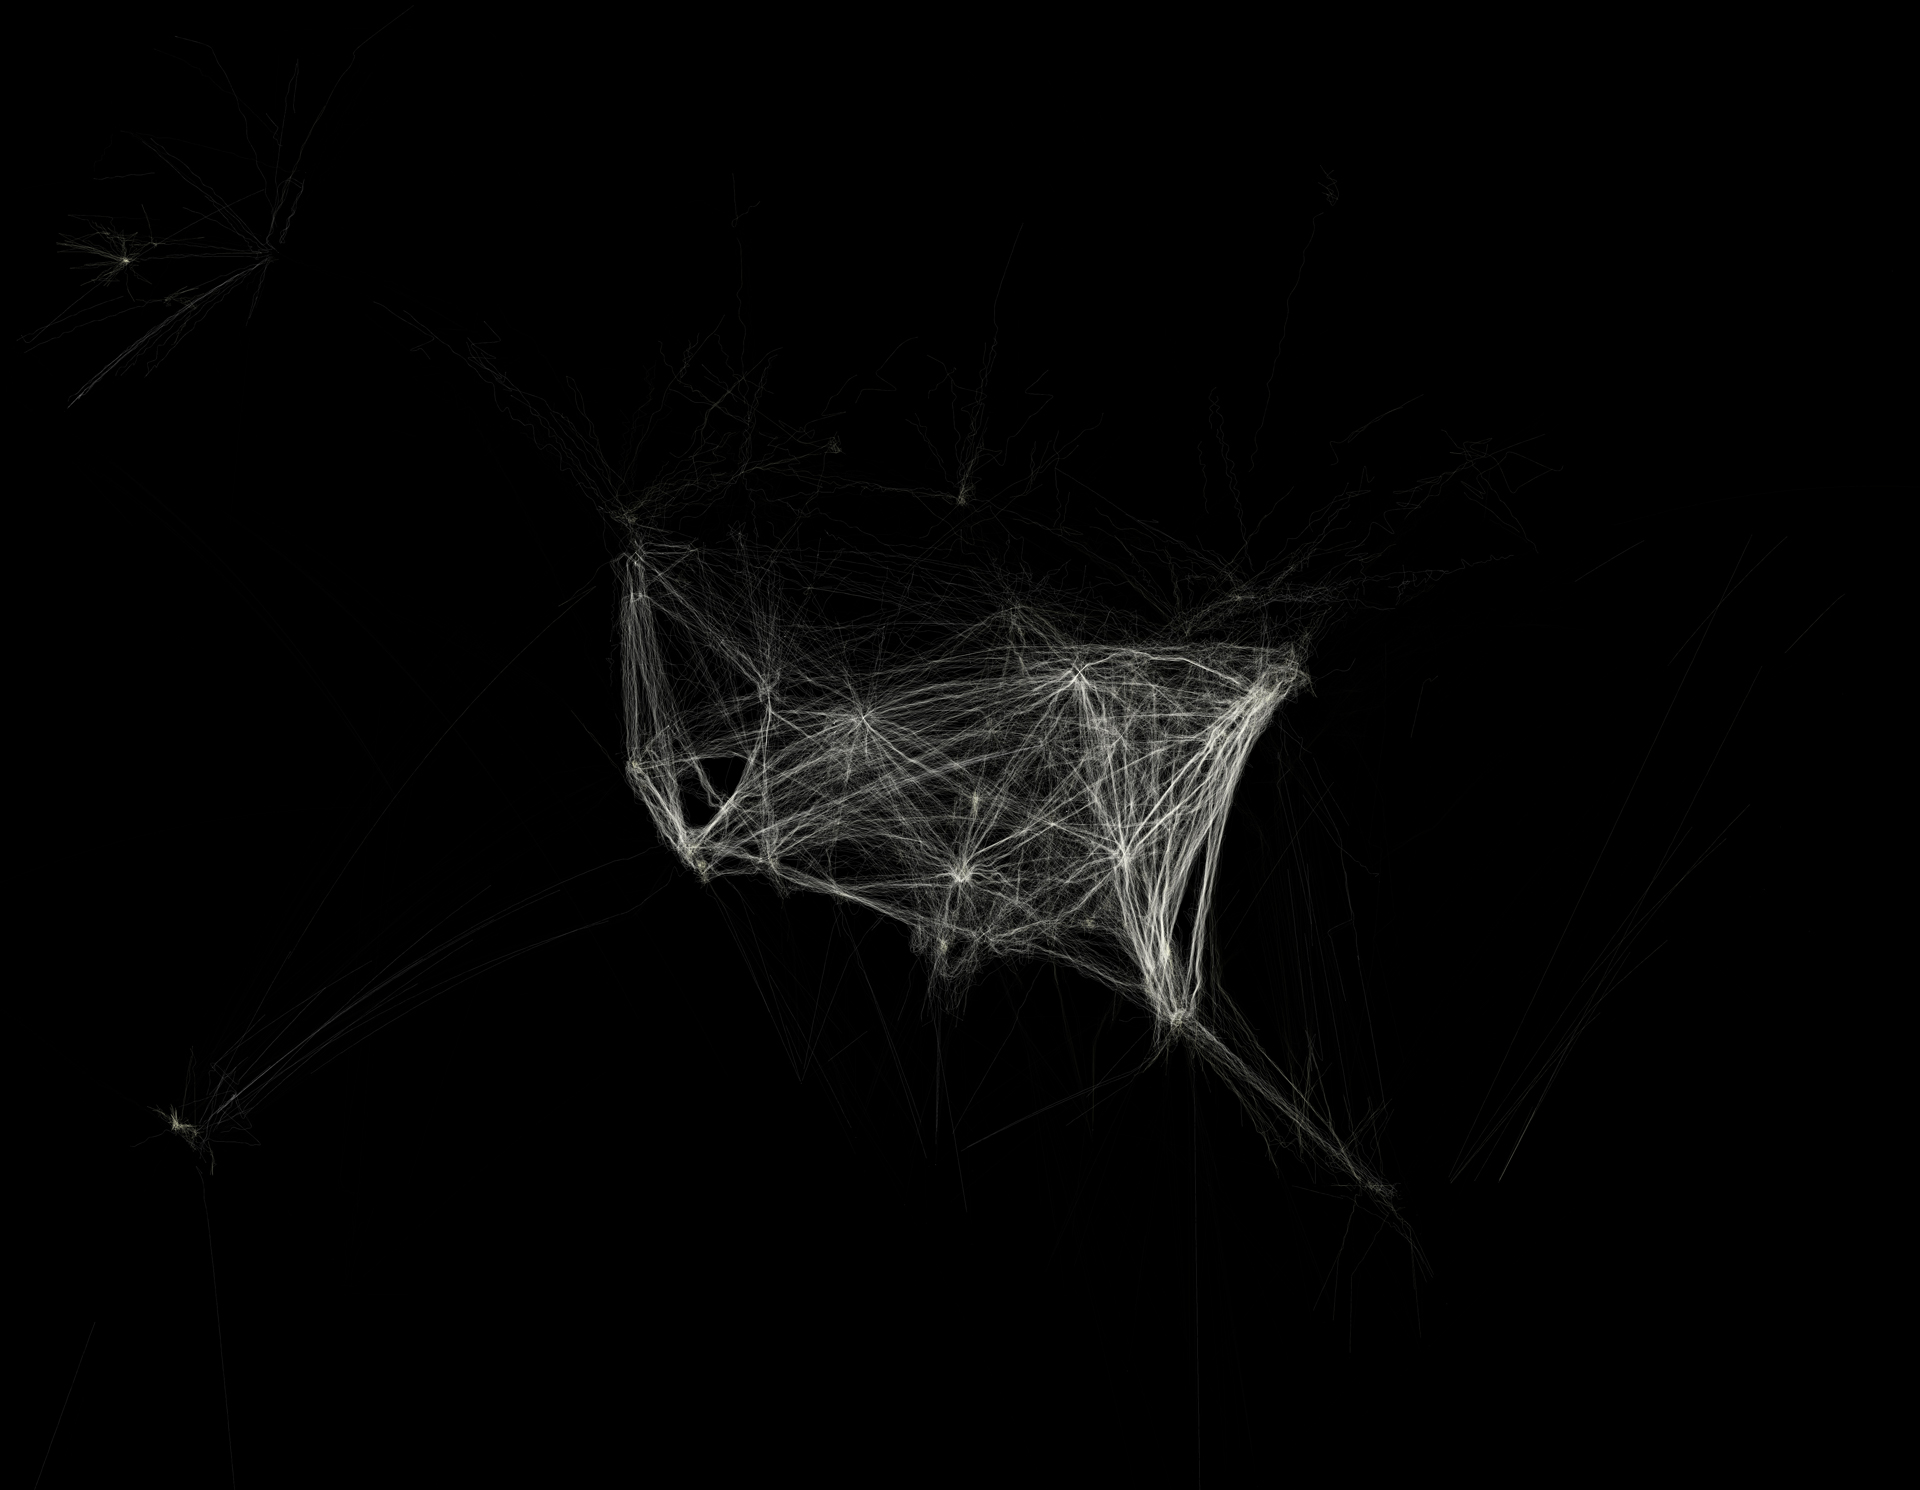
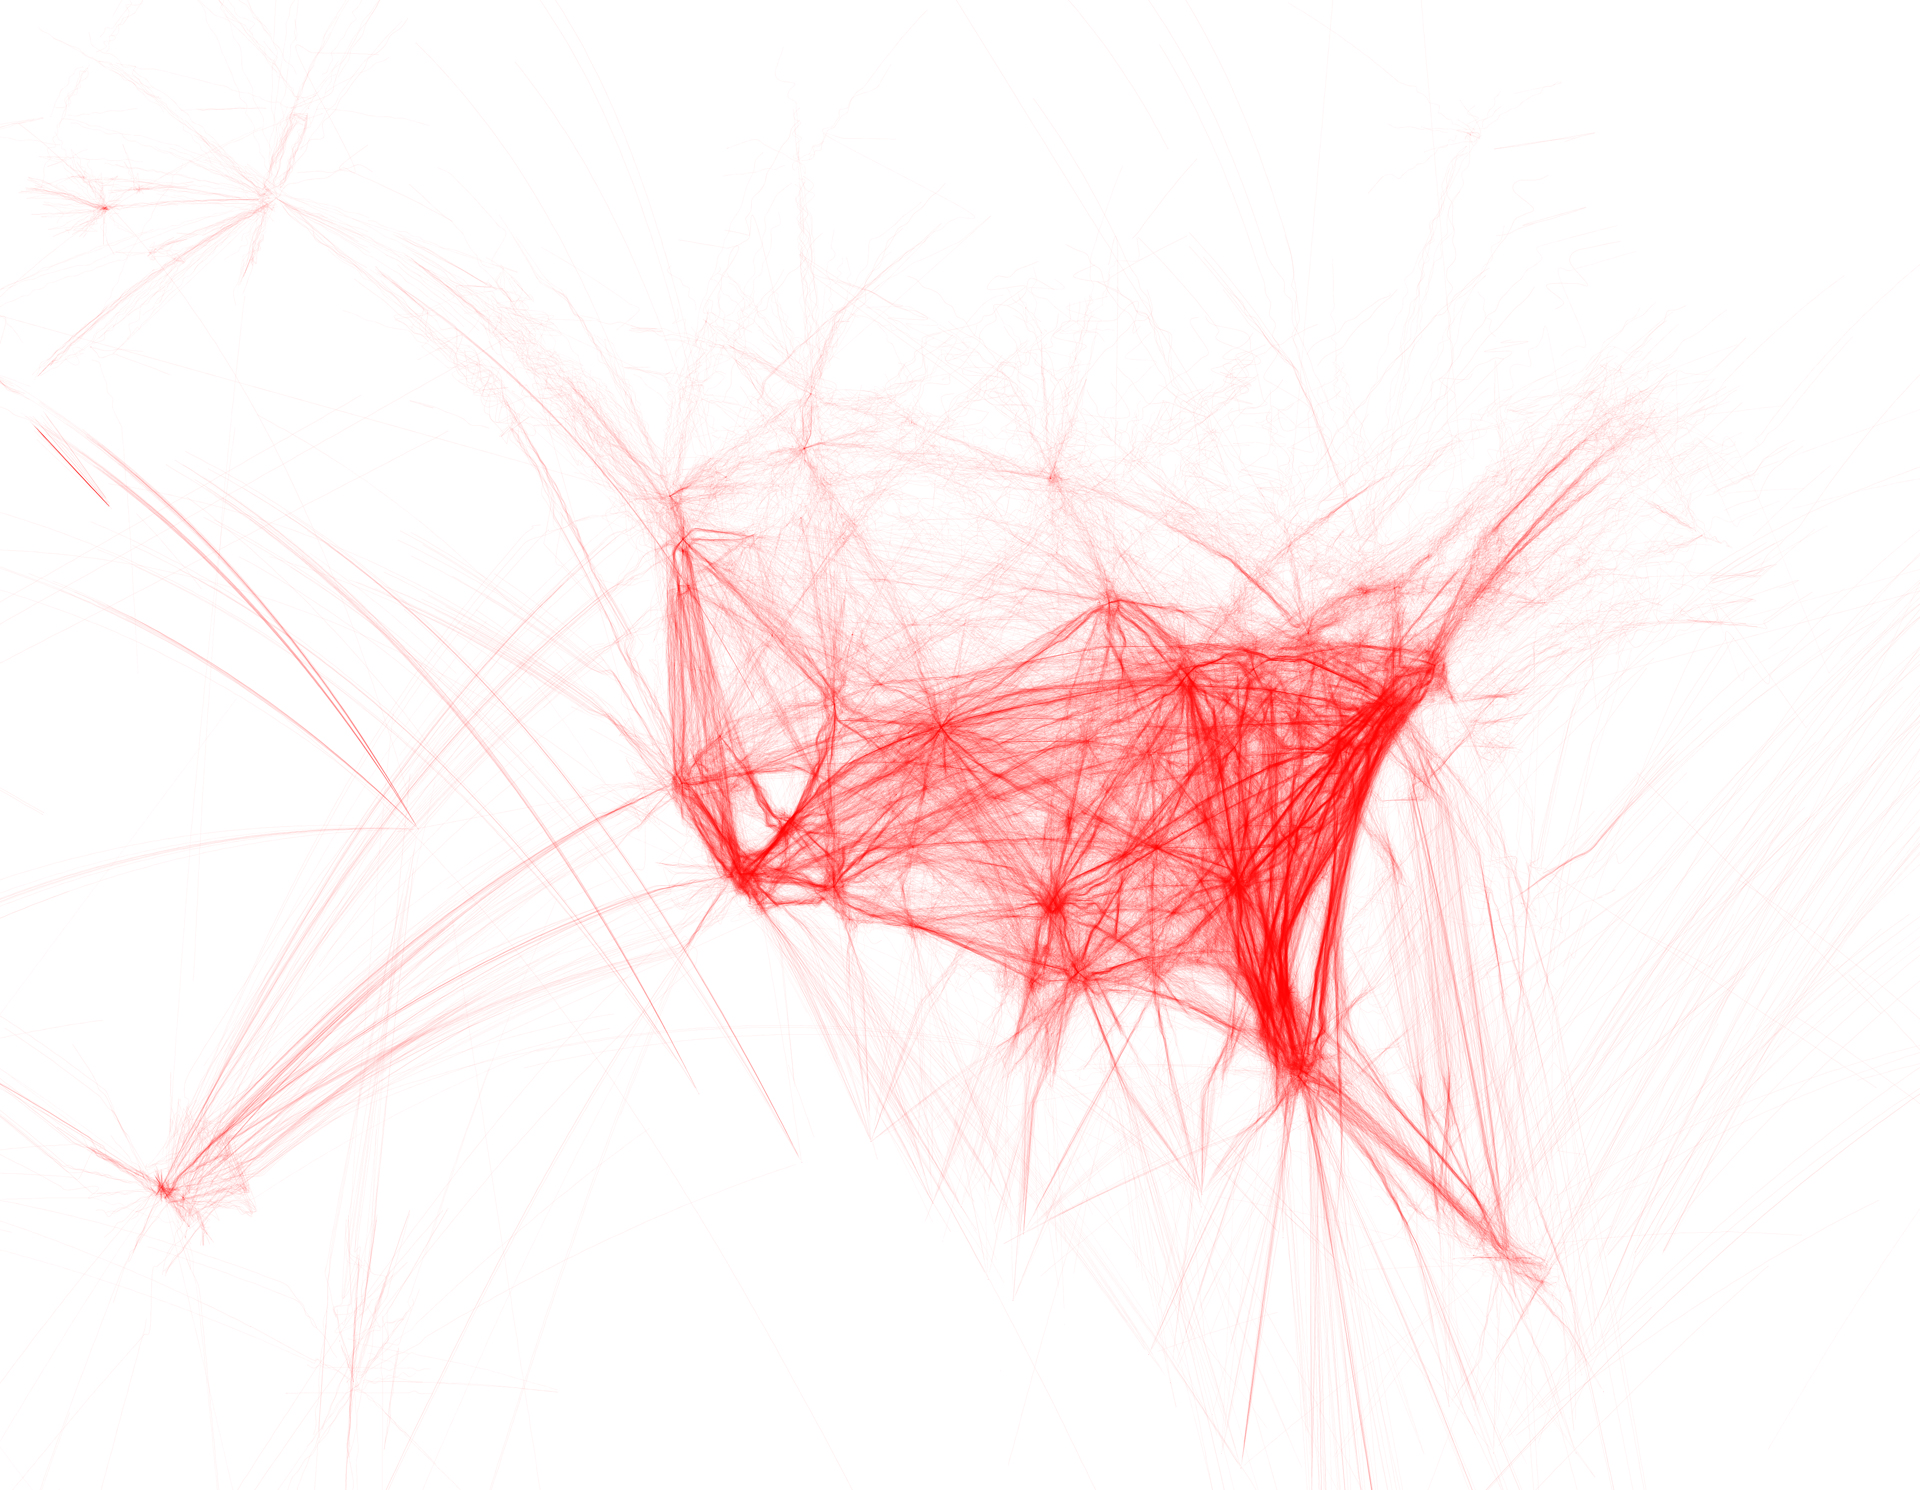
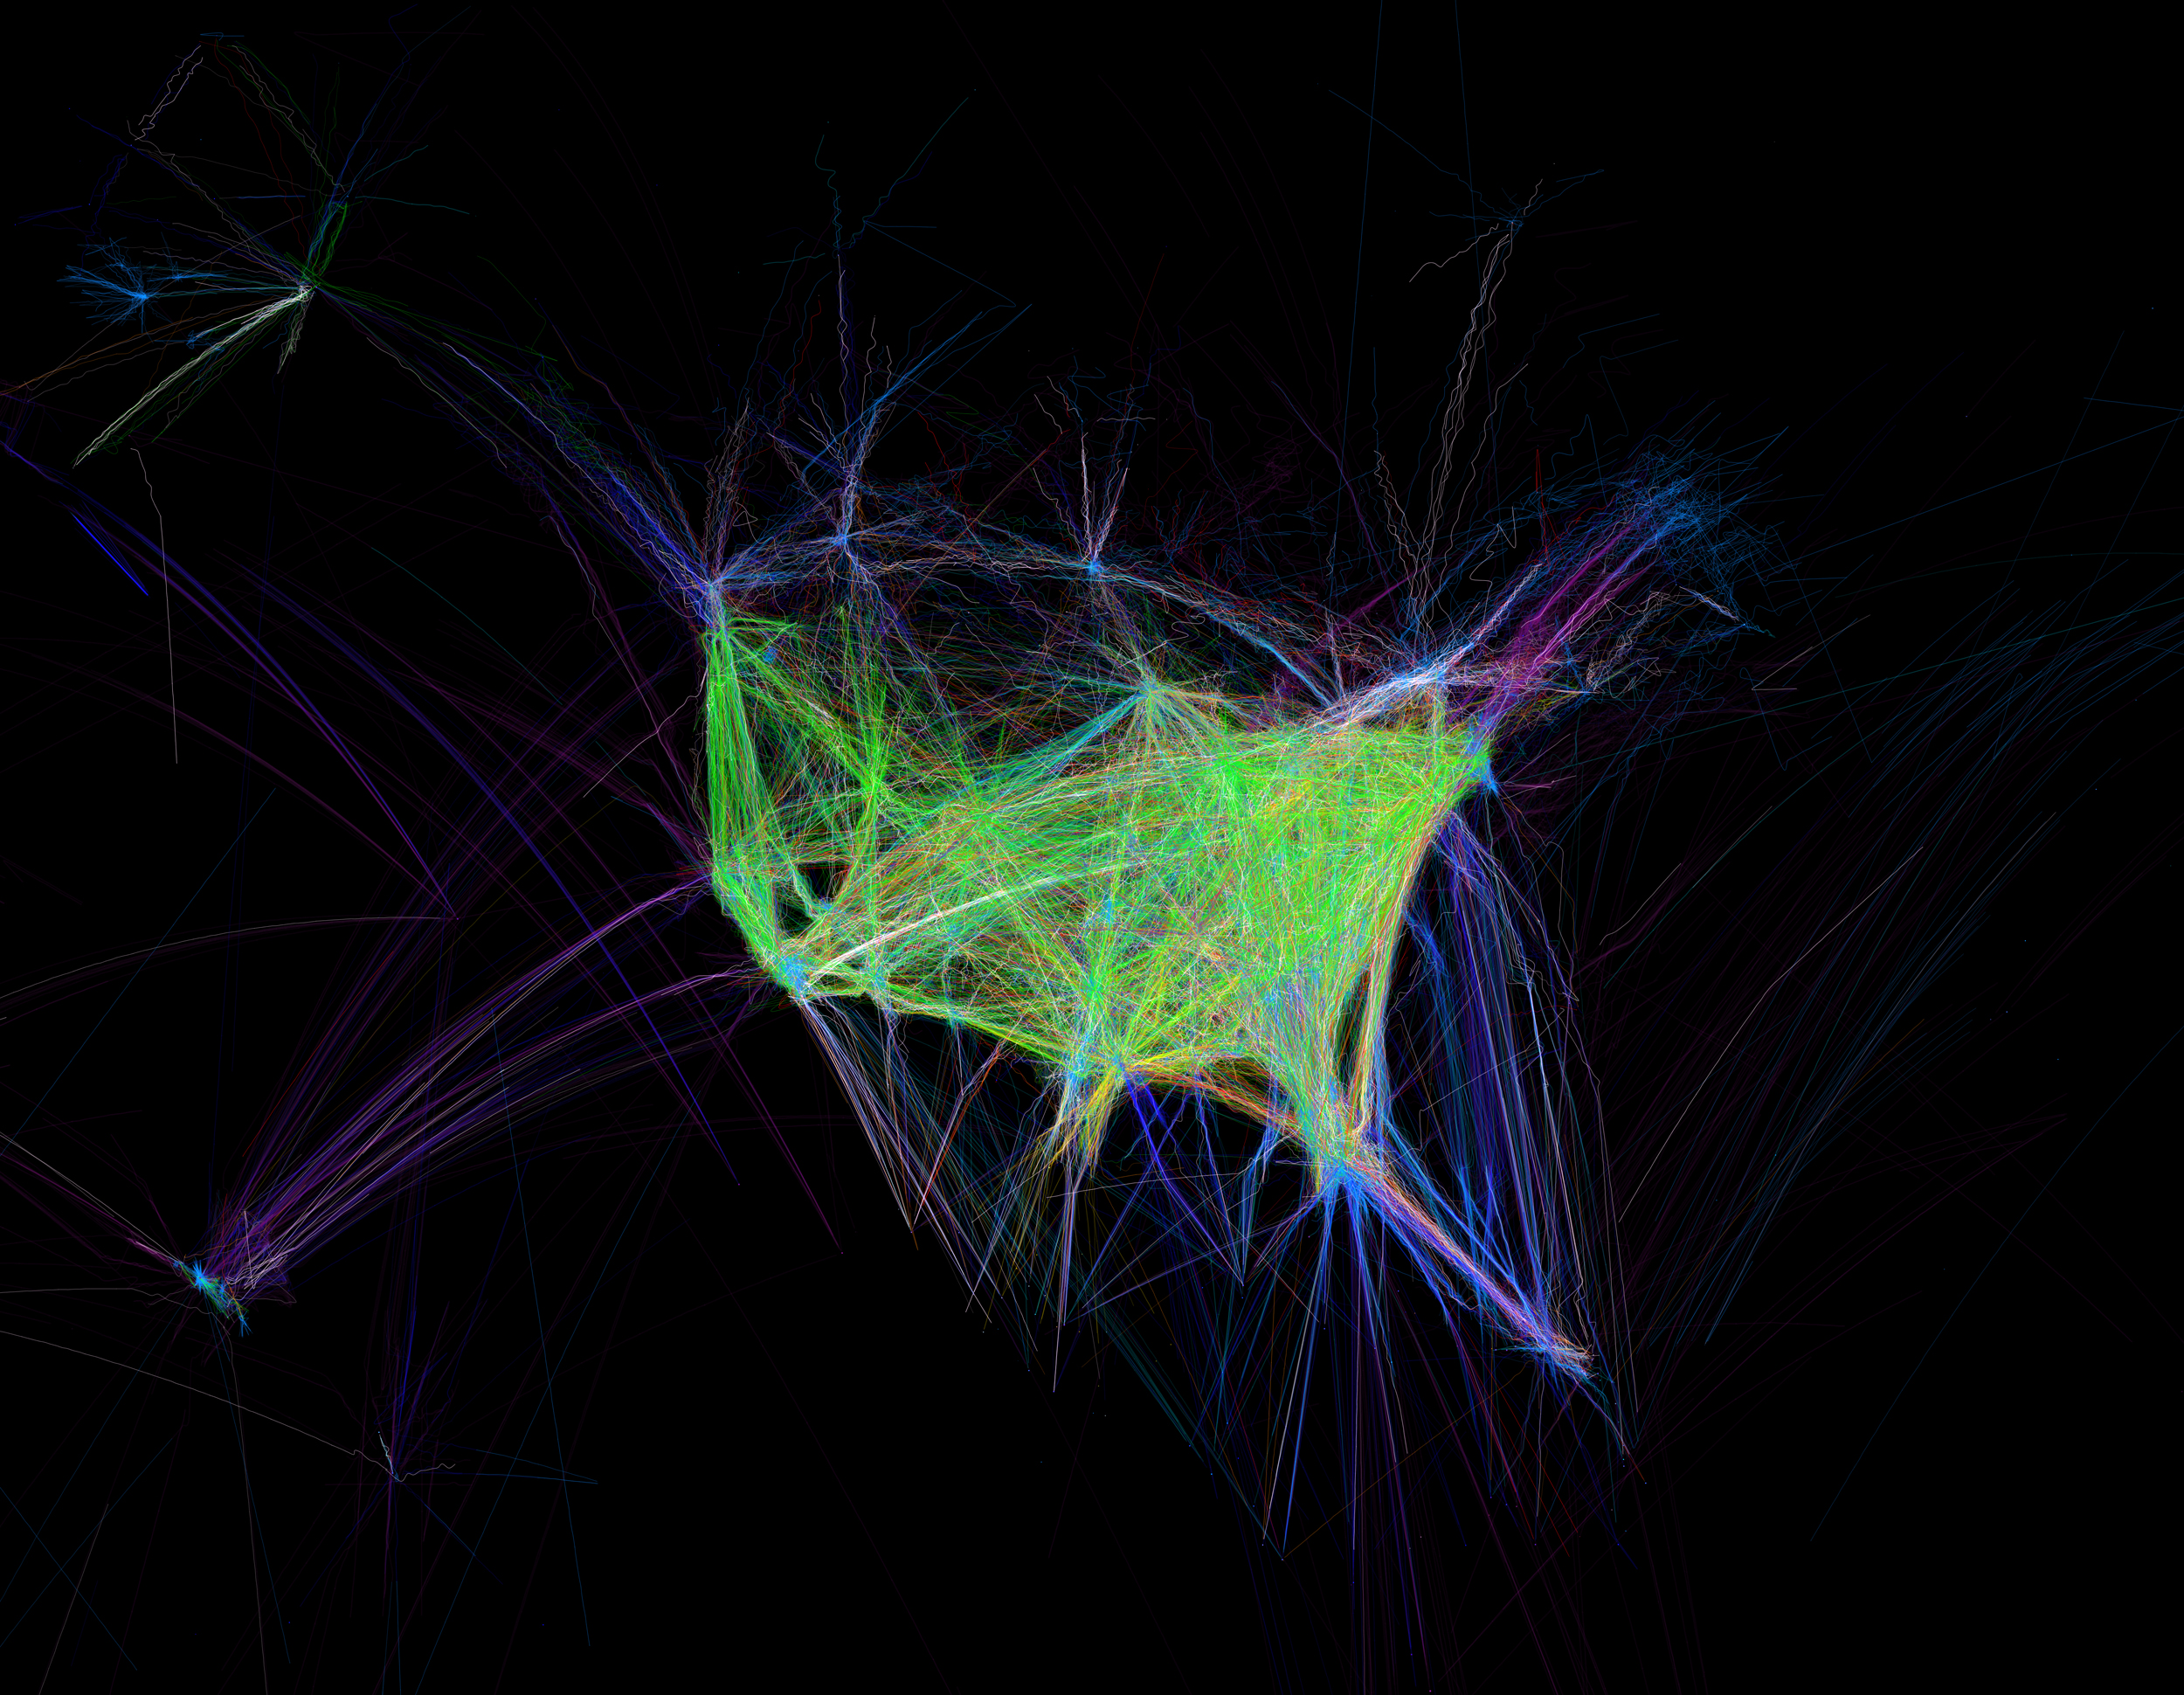
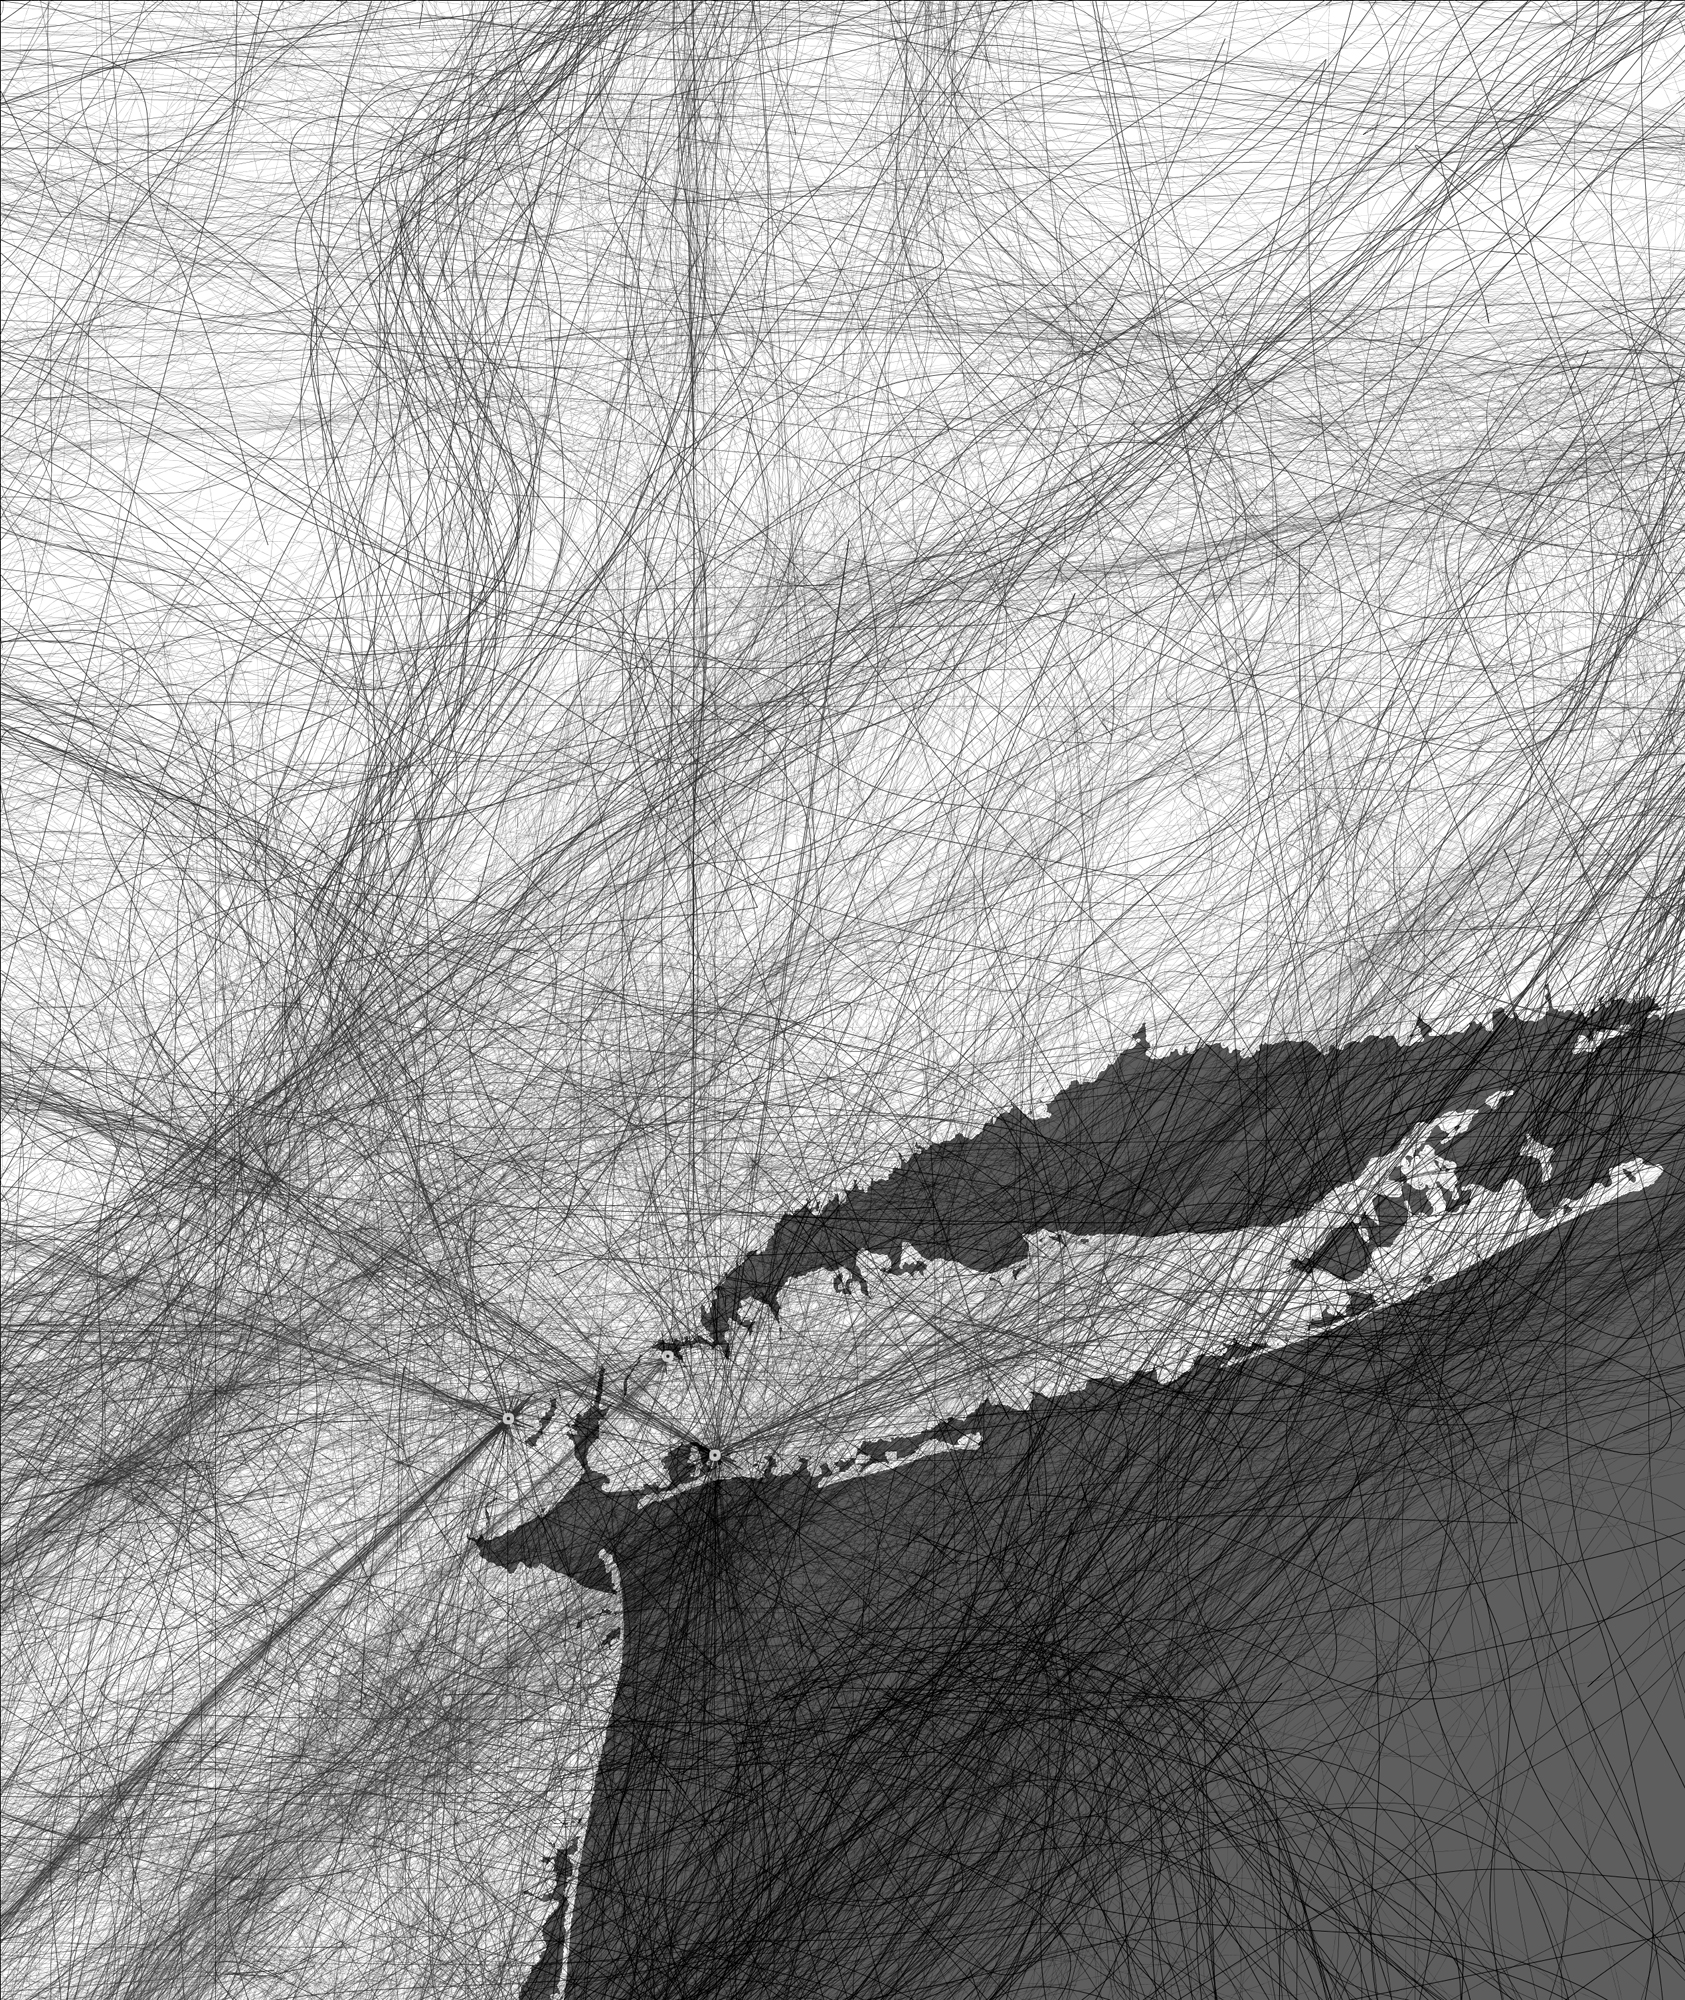
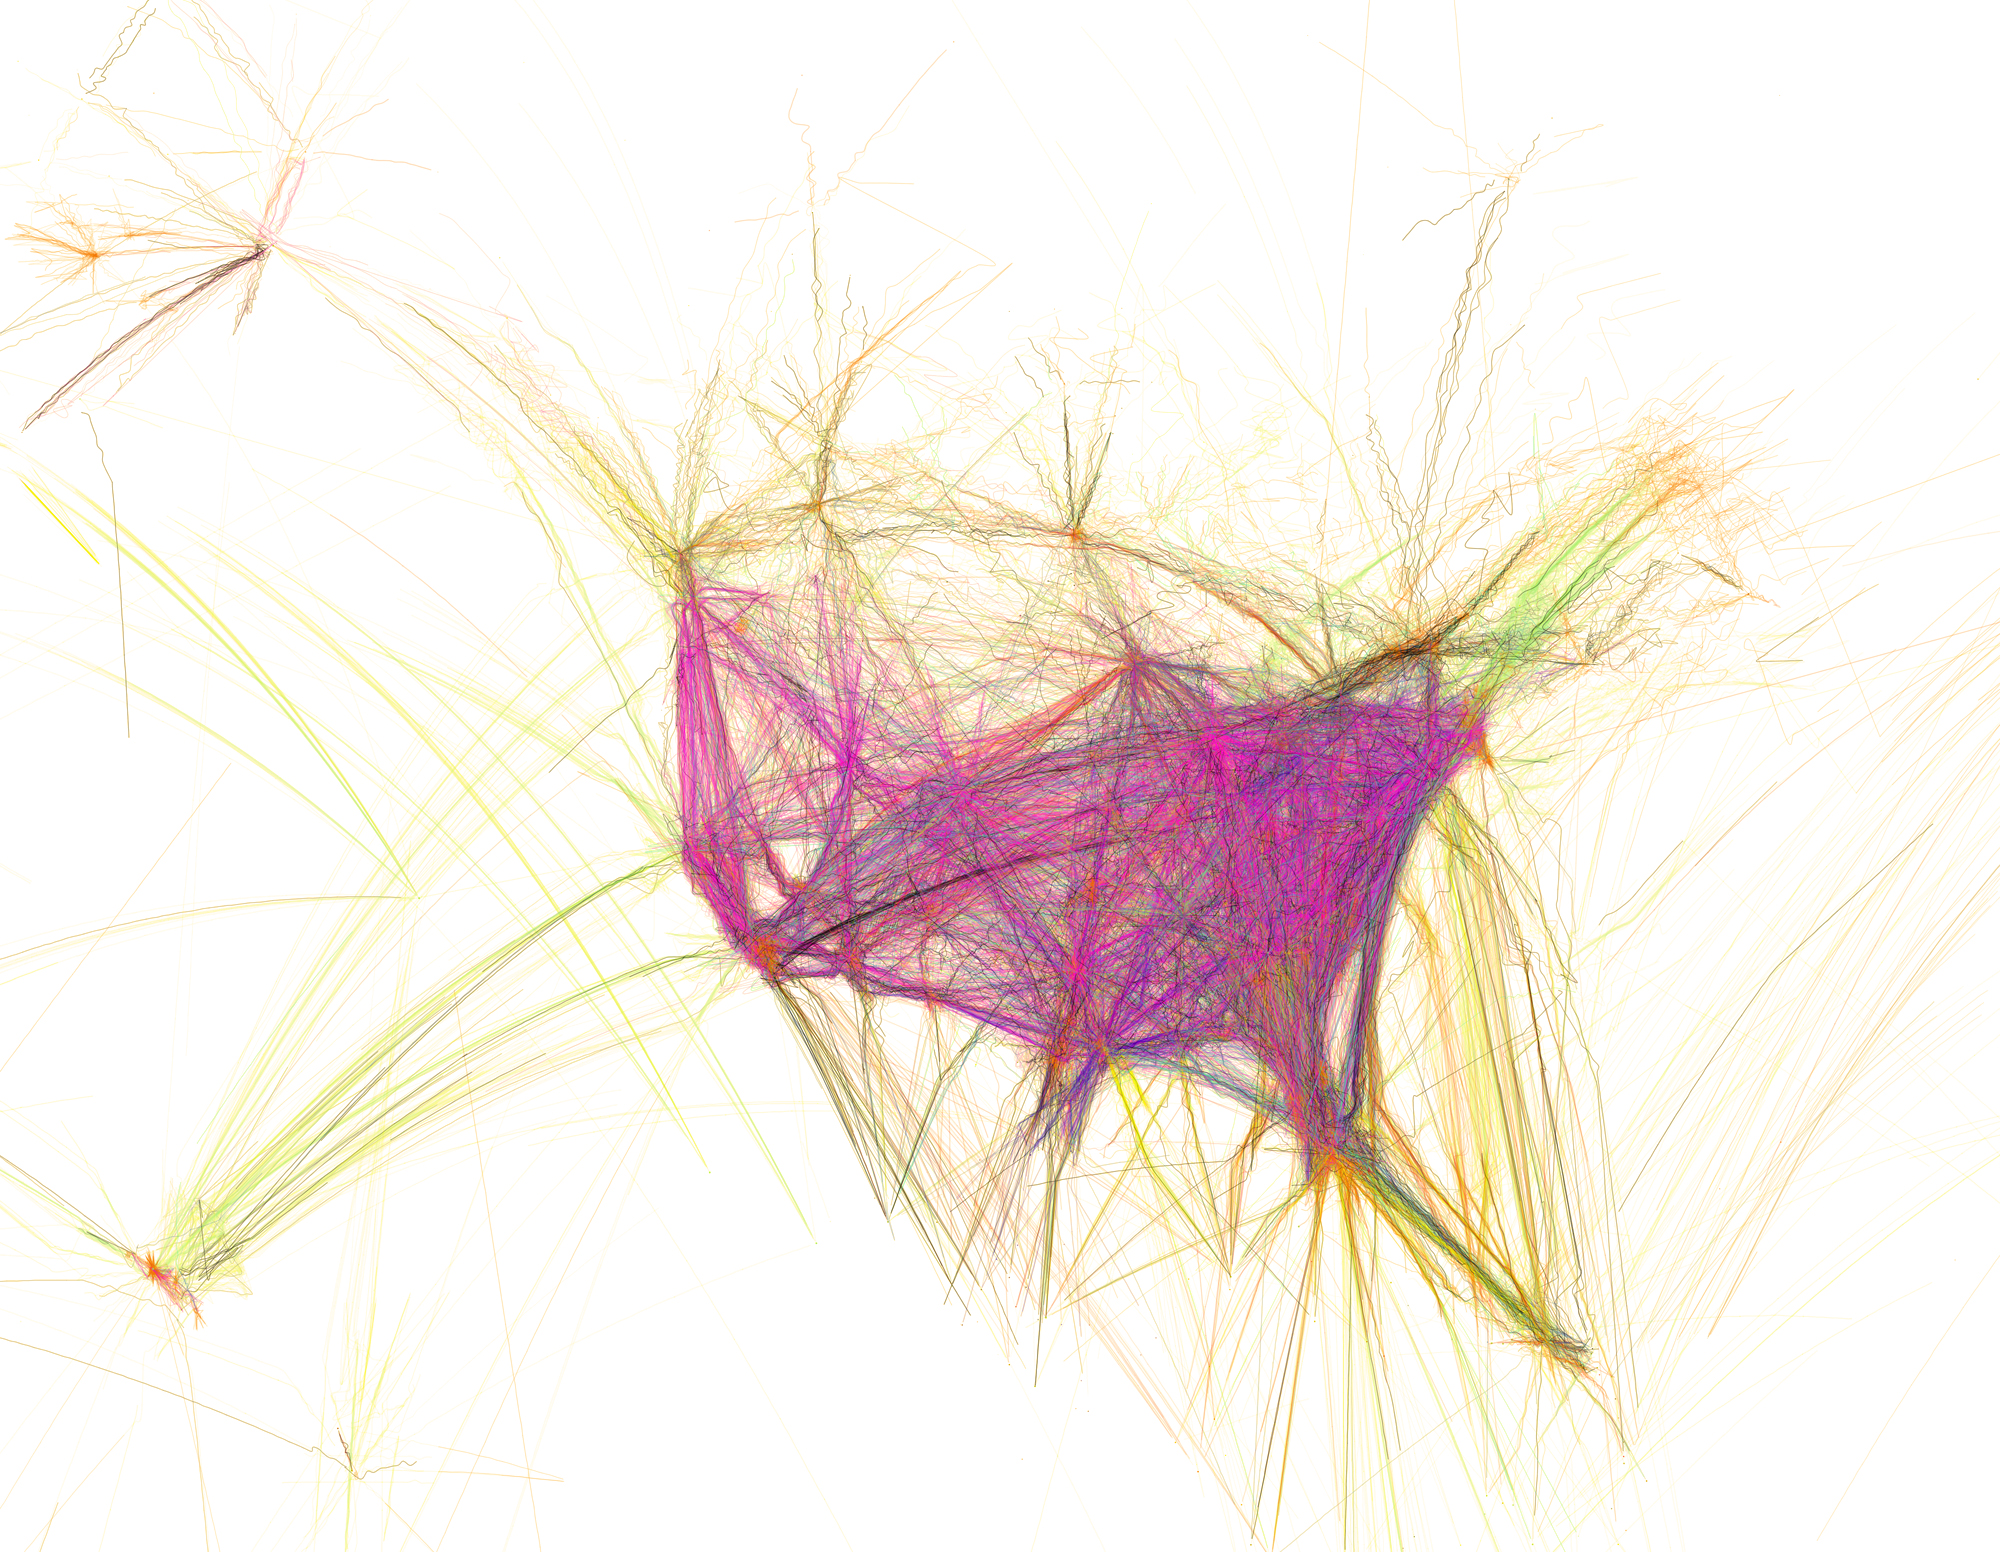
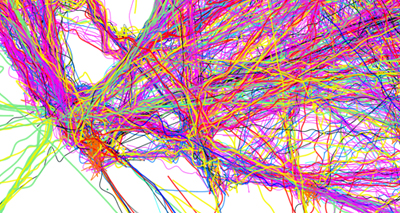
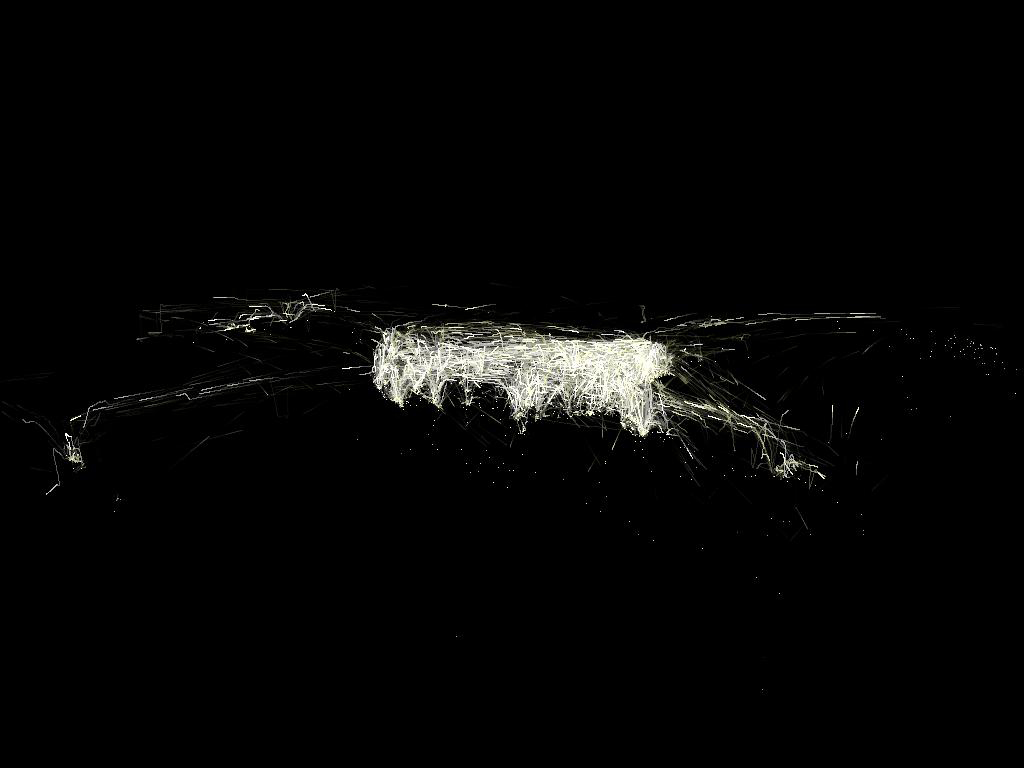
Air traffic as seen by the FAA (revisited).
New data and an improved interpolation algorithm has led to revised depictions of air traffic over the U.S. and Canada. FAA data was parsed and plotted using the Processing programming environment, and the frames were composited with Adobe After Effects and/or Maya.
*note* Images use different degrees of interpolation which exaggerate anomalies to varying extents (paths are not exact).
Original Flight Patterns.
|
